CMPS-3480 Computer Graphics
Lab-2
    Add line of code to your main function in lab2.cpp

    while (!done) {
        while (x11.getPending()) {
            ...
        }
        usleep(200); <----- add that line.
    }
Elements of the lab:
- Draw multiple line segments.
- Add and delete points.
- Highlight point closest to mouse cursor.
- Mouse grab, drag, and release.
- Rubberband line segments.
- Rigid line segments.
- Bresenham's line algorithm.
- Bezier curves.
Step 1:
We will do some coding together on the Zoom big-screen.
Get the starting code at:
/home/fac/gordon/p/3480/code/lab2/lab2.cpp
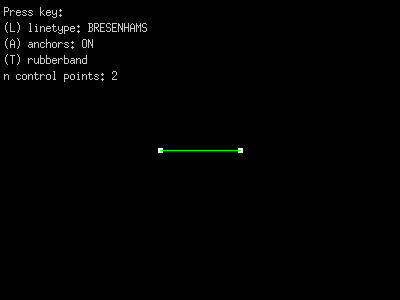
We will add the following features together...
1. connecting points with lines
2. adding more points (and lines)
3. add the Bresenham's algorithm to draw lines
4. adding anchors to see points better
5. grab a point with the mouse and move it
rubber-band lines
6. make line segments 'rigid' and drag a point.
Our program will look something like this

additional features needed for homework:
1. When mouse is close enough to a point, draw a red box around the point.

2. When a point is dragged with the mouse, the point does not "snap" to the
   mouse pointer.

3. Pressing the Delete key (on the keyboard) will remove the most recently
   added point. Leave at least 2 points on the screen please.

4. Any rigid point may be dragged, and all other points will react properly.
How to do rigid lines...
Make option for rigid line segments.
Use the R key to toggle between the lines stretching like
rubber-bands, and being rigid.
When rigid, the lines should retain their length even as you drag the
points around the drawing surface.
hints:
When you toggle to rigid-mode, calculate and store the length of all
line segments on screen.
Line segments are:
point 0 to 1
point 1 to 2
point 2 to 3
etc.
When you drag a point, move the other points in a way that the
length of segments is maintained.
 Completing this step requires:
. a vector
. distance between points (magnitude)
. a normalized vector
. scaling a vector
Hint:
Change the g.pt array from int to double.
More hints:
Given just two points on the screen,
and you moved point0 with your mouse...
1. Make a vector from point0 to point1.
subtract point0 from point1.
2. Normalize that vector.
3. Scale the vector to the length it should be.
Multiply x and y by the length scalar.
(You saved the length when "T" was pressed).
4. Set point1 to:
point0 + vector.
code from class...
Completing this step requires:
. a vector
. distance between points (magnitude)
. a normalized vector
. scaling a vector
Hint:
Change the g.pt array from int to double.
More hints:
Given just two points on the screen,
and you moved point0 with your mouse...
1. Make a vector from point0 to point1.
subtract point0 from point1.
2. Normalize that vector.
3. Scale the vector to the length it should be.
Multiply x and y by the length scalar.
(You saved the length when "T" was pressed).
4. Set point1 to:
point0 + vector.
code from class...
in global...
double pt[MAX_POINTS][2];
int n;
double line_lengths[MAX_POINTS];
in check_keys...
case XK_t:
g.rubberband = g.rubberband ^ 1;
if (!g.rubberband) {
//save all line lengths
for (int i=0; i<g.n-1; i++) {
double d0 = g.pt[i][0] - g.pt[i+1][0];
double d1 = g.pt[i][1] - g.pt[i+1][1];
double len = sqrt(d0*d0 + d1*d1);
g.line_lengths[i] = len;
}
}
when mouse MotionNotify...
if (!g.rubberband) {
//rigid, move the other point!!!
double v[2];
v[0] = g.pt[1][0] - g.pt[0][0];
v[1] = g.pt[1][1] - g.pt[0][1];
//normalize
double len = sqrt(v[0]*v[0] + v[1]*v[1]);
v[0] /= len;
v[1] /= len;
//scale the vector
v[0] *= g.line_lengths[closest];
v[1] *= g.line_lengths[closest];
//change the other point
g.pt[1][0] = g.pt[0][0] + v[0];
g.pt[1][1] = g.pt[0][1] + v[1];
}
Bresenham's line algorithm:
Add an option to draw lines with Bresenham's line algorithm.

We discussed this algorithm in class lecture on Monday.


Here is an implementation of Bresenham's line algorithm.

int steep = (abs(y1-y0) > abs(x1-x0));
if (steep) {
    SWAP(x0, y0);
    SWAP(x1, y1);
}
if (x0 > x1) {
    SWAP(x0, x1);
    SWAP(y0, y1);
}
int ystep = (y1>y0) ? 1 : -1;
int yDiff = abs(y1-y0);
int xDiff = x1 - x0;
int error = 0;
int x, y = y0;
for (x=x0; x<=x1; x++) {
    if (steep)
        x11.drawPoint(y, x);
    else
        x11.drawPoint(x, y);
    error -= yDiff;
    if (error <= 0) {
        y += ystep;
        error += xDiff;
    }
}

Do not use the C++ swap library function.
We will write a SWAP macro for our program in lab class.

When you toggle between Bresenham and X11 line algorithms, you will see that
the lines are drawn a little differently. There is a slight change you can make
to the Bresenham code above so that the lines are drawn the same. See if you can
find where the change needs to be made. Look closely at the lines.
Curves:
Add this feature to your program.
Add Bezier curves between your points.
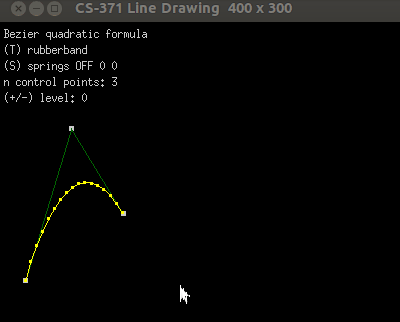 Your program should look similar.
Bezier equations
1. Designate a key-press to turn on curve-mode.
For example, the "C" key.
Show that in your menu.
2. Apply the Bezier quadratic equation:
B(t) = (1-t)*(1-t)*P0 + 2*(1-t)*t*P1 + t*t*P2
where: P0 is g.pt[0]
P1 is g.pt[1]
P2 is g.pt[2]
t is a variable
t will go from 0.0 to 1.0 in small steps (inside a for-loop)
You might define it like so:
double t;
B(t) is a point on the curve.
It will have x and y components.
You might define it like so:
double B[2];
This statement...
B(t) = (1-t)*(1-t)*P0 + 2*(1-t)*t*P1 + t*t*P2
means what is the value of point B at time t given anchor points P0 P1 P2.
Connect each point B(t) on the curve with a straight line.
It will look like a curve.
You can get a curve drawn in about 10 lines of code.
Give it a try.
3. For more than 3 points:
Notice that the end-points are always used as Bezier control points.
When more than 3 points are present, please use the midpoint of the
inner line-segments as control points. Look at the animation above to
see a demonstration of this.
Hints:
The quadratic equation is just 2 lines of code.
Use a for-loop to step through the points.
Example for 3 points...
At point 0: Use 0, 1, 2
end.
Example for 5 control points...
At control-point 0: Use 0, 1, mid(1,2)
1: Use mid(1,2), 2, mid(2,3)
2: Use mid(2,3) 3, 4
end.
(be careful not to over-flow)
Use a nested for-loop to step "t" from 0.0 to 1.0,
as you are calculating the curve points.
Connect the curve points with straight lines.
Your program should look similar.
Bezier equations
1. Designate a key-press to turn on curve-mode.
For example, the "C" key.
Show that in your menu.
2. Apply the Bezier quadratic equation:
B(t) = (1-t)*(1-t)*P0 + 2*(1-t)*t*P1 + t*t*P2
where: P0 is g.pt[0]
P1 is g.pt[1]
P2 is g.pt[2]
t is a variable
t will go from 0.0 to 1.0 in small steps (inside a for-loop)
You might define it like so:
double t;
B(t) is a point on the curve.
It will have x and y components.
You might define it like so:
double B[2];
This statement...
B(t) = (1-t)*(1-t)*P0 + 2*(1-t)*t*P1 + t*t*P2
means what is the value of point B at time t given anchor points P0 P1 P2.
Connect each point B(t) on the curve with a straight line.
It will look like a curve.
You can get a curve drawn in about 10 lines of code.
Give it a try.
3. For more than 3 points:
Notice that the end-points are always used as Bezier control points.
When more than 3 points are present, please use the midpoint of the
inner line-segments as control points. Look at the animation above to
see a demonstration of this.
Hints:
The quadratic equation is just 2 lines of code.
Use a for-loop to step through the points.
Example for 3 points...
At point 0: Use 0, 1, 2
end.
Example for 5 control points...
At control-point 0: Use 0, 1, mid(1,2)
1: Use mid(1,2), 2, mid(2,3)
2: Use mid(2,3) 3, 4
end.
(be careful not to over-flow)
Use a nested for-loop to step "t" from 0.0 to 1.0,
as you are calculating the curve points.
Connect the curve points with straight lines.