Statistical Tests
In data science, statistical tests are used to validate hypotheses, compare groups, identify relationships between variables, and make reliable conclusions about data by determining whether observed patterns are statistically significant and not simply due to chance; essentially allowing data scientists to draw meaningful insights from their analysis with confidence.
A Z-test is any statistical test for which the distribution of the test statistic under the null hypothesis can be approximated by a normal distribution.
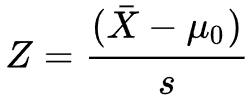
h = ztest(x,m,sigma) returns a test decision for the null hypothesis that the data in the vector x comes from a normal distribution with mean m and a standard deviation sigma, using the z-test. The alternative hypothesis is that the mean is not m. The result h is 1 if the test rejects the null hypothesis at the 5% significance level, and 0 otherwise.
Student's t-test is a statistical test used to test whether the difference between the response of two groups is statistically significant or not. It is any statistical hypothesis test in which the test statistic follows a Student's t-distribution under the null hypothesis.
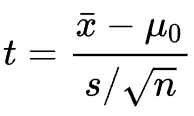
h = ttest2(x,y) returns a test decision for the null hypothesis that the data in vectors x and y comes from independent random samples from normal distributions with equal means and equal but unknown variances, using the two-sample t-test. The alternative hypothesis is that the data in x and y comes from populations with unequal means. The result h is 1 if the test rejects the null hypothesis at the 5% significance level, and 0 otherwise.
The Mann–Whitney U test (Wilcoxon rank-sum test) is a nonparametric statistical test of the null hypothesis that, for randomly selected values X and Y from two populations, the probability of X being greater than Y is equal to the probability of Y being greater than X.
![]()
p = ranksum(x,y) returns the p-value
of a two-sided Wilcoxon rank sum test. ranksum tests the null
hypothesis that data in x and y are samples from continuous
distributions with equal medians, against the alternative that
they are not. The test assumes that the two samples are
independent. x and y can have different lengths.
This test is equivalent to a Mann-Whitney U-test.

I have a big farm, where I collect all kinds of fruits.
To make the wine,
majority of collections are
Merlot (super good; BIG and sweet); some are blueberry (bad,
ruin my wine; SMALL and sour).
I lost the fruit name label, can you do some statistical test?