Statistical Tools
There are so many statistical tools help researchers and analysts understand the datasets.
Here are some basic examples.
A variable is considered dependent if it depends on an independent variable. Dependent variables are studied under the supposition or demand that they depend, by some law or rule (e.g., by a mathematical function), on the values of other variables.
For this verison of Army dataset, please calculate the distance.
A p-value measures the probability of obtaining the observed results, assuming that the null hypothesis is true. The lower the p-value, the greater the statistical significance of the observed difference. A p-value of 0.05 or lower is generally considered statistically significant.
Informally, in frequentist statistics, a confidence interval (CI) is an interval which is expected to typically contain the parameter being estimated.
Confidence Interval = Sample Mean +/- Margin of Error.
In winery
example, first row
is the diameter of each individual fruit, second row is whether
it is a Merlot or not.
For Merlot, what is the average diameter? Are you sure?
We own an orange farm. Every 10 oranges will be packaged as one box.
Here are the orange sizes from one box:
[85, 92, 78, 89, 90, 82, 75, 86, 88, 91]
What is the mean value of oranges' size?
Are you sure?
ANOVA table
An ANOVA table is a table that organizes calculations to compare variances between groups. It's a statistical tool used to determine if there are significant differences between means.
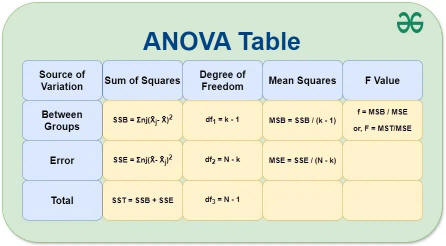
How to calculate