Data Summaries
There are many approaches may be viewed as data “summarization”. The most immediate effect of summarizing data is to take data that may be overwhelming to work with, and reduce it to a few key summary values that can be viewed, often in a table or plot.

Now, I own a winery, and I collect
grapes to make the wine.
Majority of collections are
Merlot (super good; BIG and sweet); some are blueberry (bad,
ruin my wine; SMALL and sour).
How can we summarize this data?
Max, Min
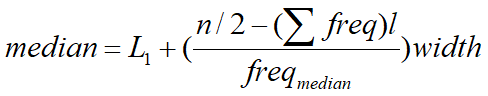
Median
What if we have even data?
What if we have group data?
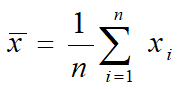
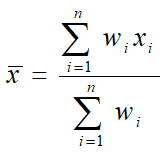
Mean (Average)
Basic Situation? Not everything equal?
Mode
By definition?
An empirical relationship!
Magic Spell
How it looks like
Symmetrical
Negative skew (left-skewed) VS Positive skew (right-skewed)
During the three years between the 2019 and 2022 surveys, the COVID-19 pandemic caused severe disruptions to the U.S. labor market and broader economic activity, leading to unprecedented levels of fiscal support. Against this backdrop, U.S. families experi enced increases in median and mean inflation-adjusted income, measured for the year before the survey.
Median income rose a relatively modest 3 percent, from $67,900 in 2018 to $70,300 in 2021. Mean income increased 15 percent—one of the largest three-year changes in mean income over the history of the modern SCF—from $123,400 in 2018 to $141,900 in 2021.
------from FEDERAL_RESERVE_Report (local image)
More visualized?
Histogram
In statistics, the standard deviation is a measure of the amount of variation of the values of a variable about its mean.
A low standard deviation indicates that the values tend to be close to the mean (also called the expected value) of the set, while a high standard deviation indicates that the values are spread out over a wider range. The standard deviation is commonly used in the determination of what constitutes an outlier and what does not.
Standard deviation may be abbreviated SD or std dev, and is most commonly represented in mathematical texts and equations by the lowercase Greek letter σ (sigma)
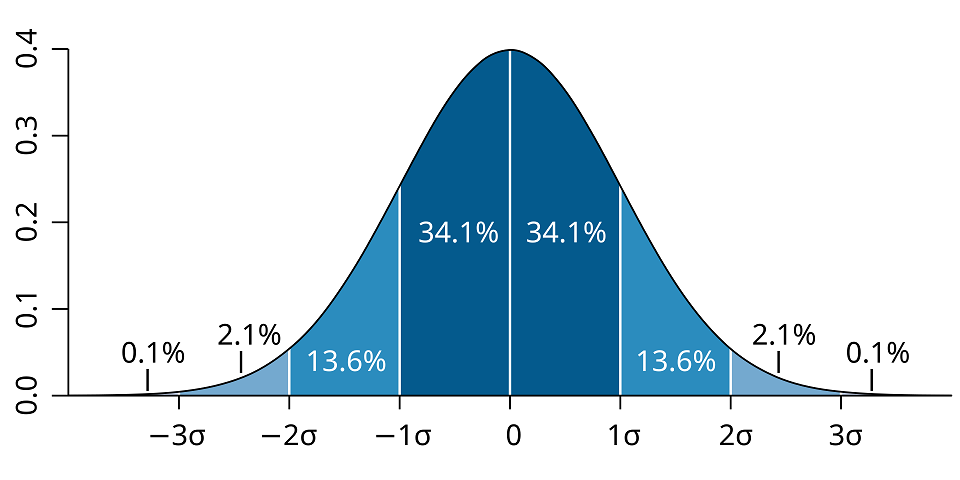
A plot of normal distribution
For the normal (distribution) curve: (μ:
mean, σ: standard deviation)
From μ–σ to μ+σ: contains about 68% of the measurements
From μ–2σ to μ+2σ: contains about 95% of it
From μ–3σ to μ+3σ: contains about 99.7% of it
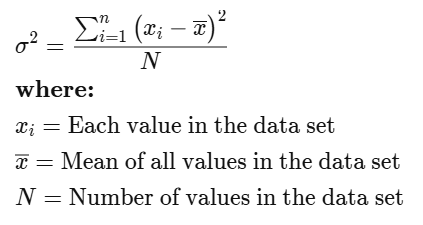
Variance is the expected value of the squared deviation from the mean of a random variable.
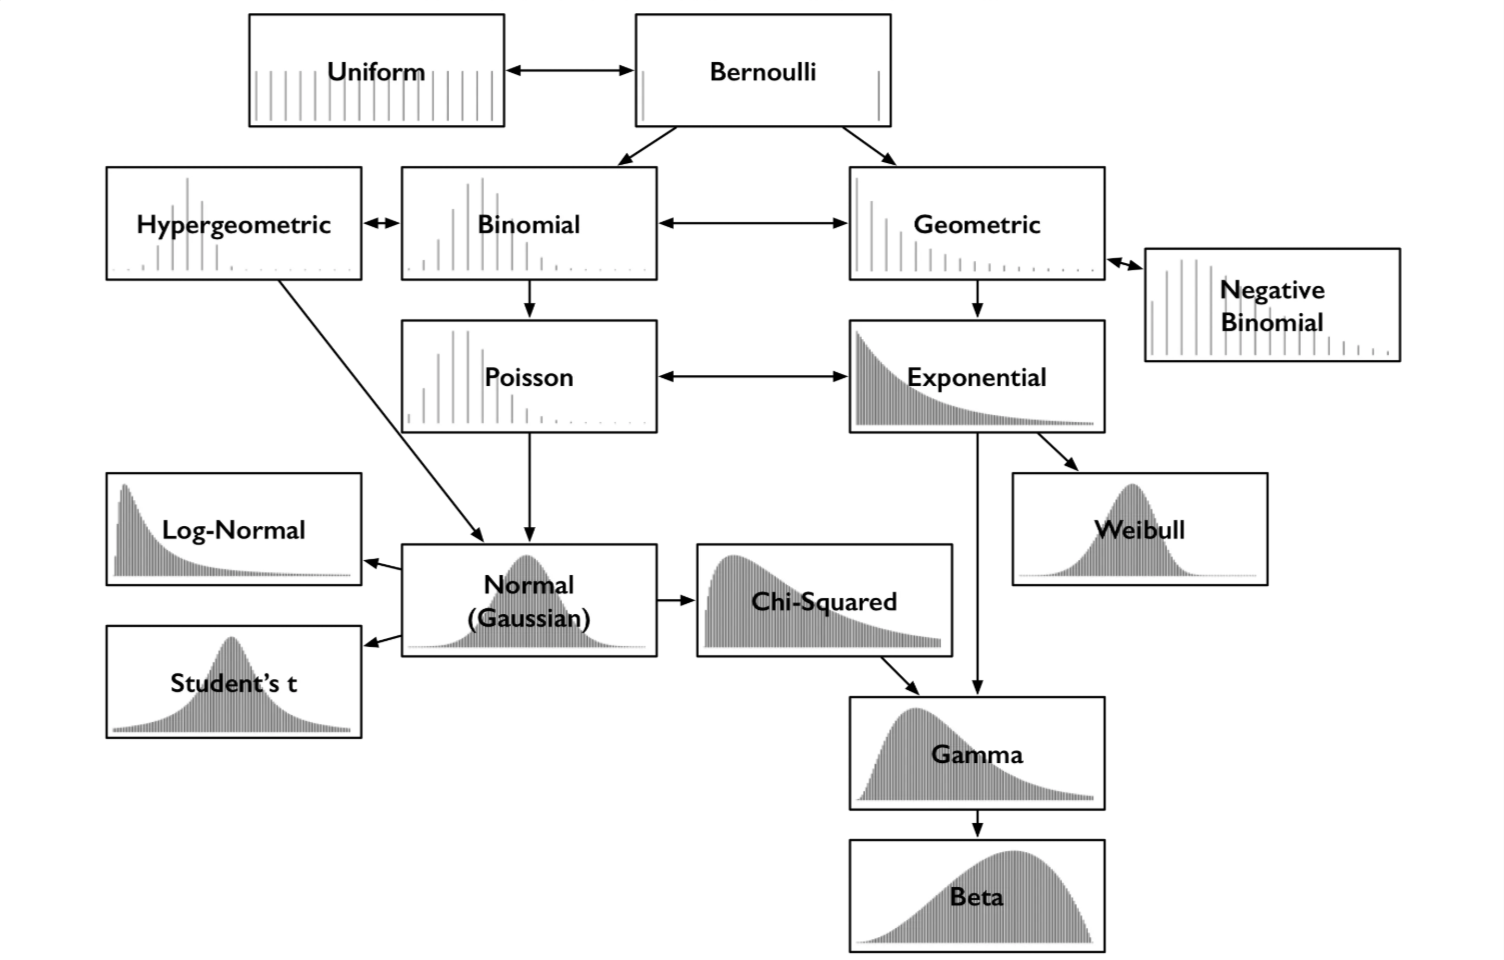
Common Probability Distributions
Data scientists have hundreds of probability distributions from which to choose. Where to start ?
Common probability distributions and some key relationships