Data Science
Performance Evaluation
Regression Problems / Classification Problems / Clustering Problems
Classification Problems
We own a credit card company, and we are
using data mining method to detect the fraud.
MY algorithm’s prediction accuracy is 98%
(98 correct out of 100 cases)
YOUR algorithm’s prediction accuracy is 99% (99 correct out of
100 cases)
| Comparison between two algorithms | ||||
| Accuracy | Precision | Recall | F1 Score | |
| Mine | ||||
| Yours | ||||

Now, I own a winery, and use a robot to help me to collect
grapes to make the wine.
Majority of robot’s collections are
Merlot (super good; BIG and sweet); some are blueberry (bad,
ruin my wine; SMALL and sour).
Now I want to design another robot to pick the right fruits
(JUST BY THE DIAMETER) to start the fermentation. What diameter
shall I choose to get better performance.
MCC score
The Matthews correlation coefficient is used in machine learning as a measure of the quality of binary (two-class) classifications, introduced by biochemist Brian W. Matthews in 1975.
Precision-Recall Curves
A precision-recall curve is a plot of the precision (y-axis) and the recall (x-axis) for different thresholds
PRcurve of the winery example.
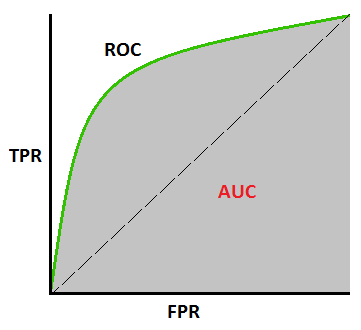
ROC Curves
A receiver operating characteristic curve, or ROC curve, is a graphical plot that illustrates the diagnostic ability of a binary classifier system as its discrimination threshold is varied.
Basicly, it is FPR vs TPR.
FPR = FP / (FP + TN);
TPR = TP / (TP + FN);
Connect all dots together, to get ROCcurve of the winery example.
AUC (Area under the curve)
The AUC value is equivalent to the probability that a randomly chosen positive example is ranked higher than a randomly chosen negative example.
AUC of ROC of the winery example.
How to find the "Sweet Spot" on an ROC Curve ?
Closest to the Top Left Corner:
The ideal ROC curve would go from the bottom left to the
top left corner (0,1), where the True Positive Rate is 1 and the
False Positive Rate is 0.
The sweet spot can be determined by finding the point on the
curve that is closest to the top-left corner.
This is done by calculating the Euclidean distance from the
point (0,1) to each point on the ROC curve and selecting the
point with the smallest distance.
D = sqrt( (FPR-0)^2 + (TPR-1)^2 )
Youden's Index:
To determine the sweet spot, you can find the threshold that
maximizes Youden’s Index.
This is the point on the ROC curve that gives the best balance
between the True Positive Rate (Sensitivity) and the True
Negative Rate (Specificity).
(Youden's Index) J = Sensitivity + Specificity − 1
Here is one example data for you to plot the following:
Accuracy-curve/Precision-curve/Recall-curve
PR-curve
ROC-curve
and caculate the AUC of ROC-curve